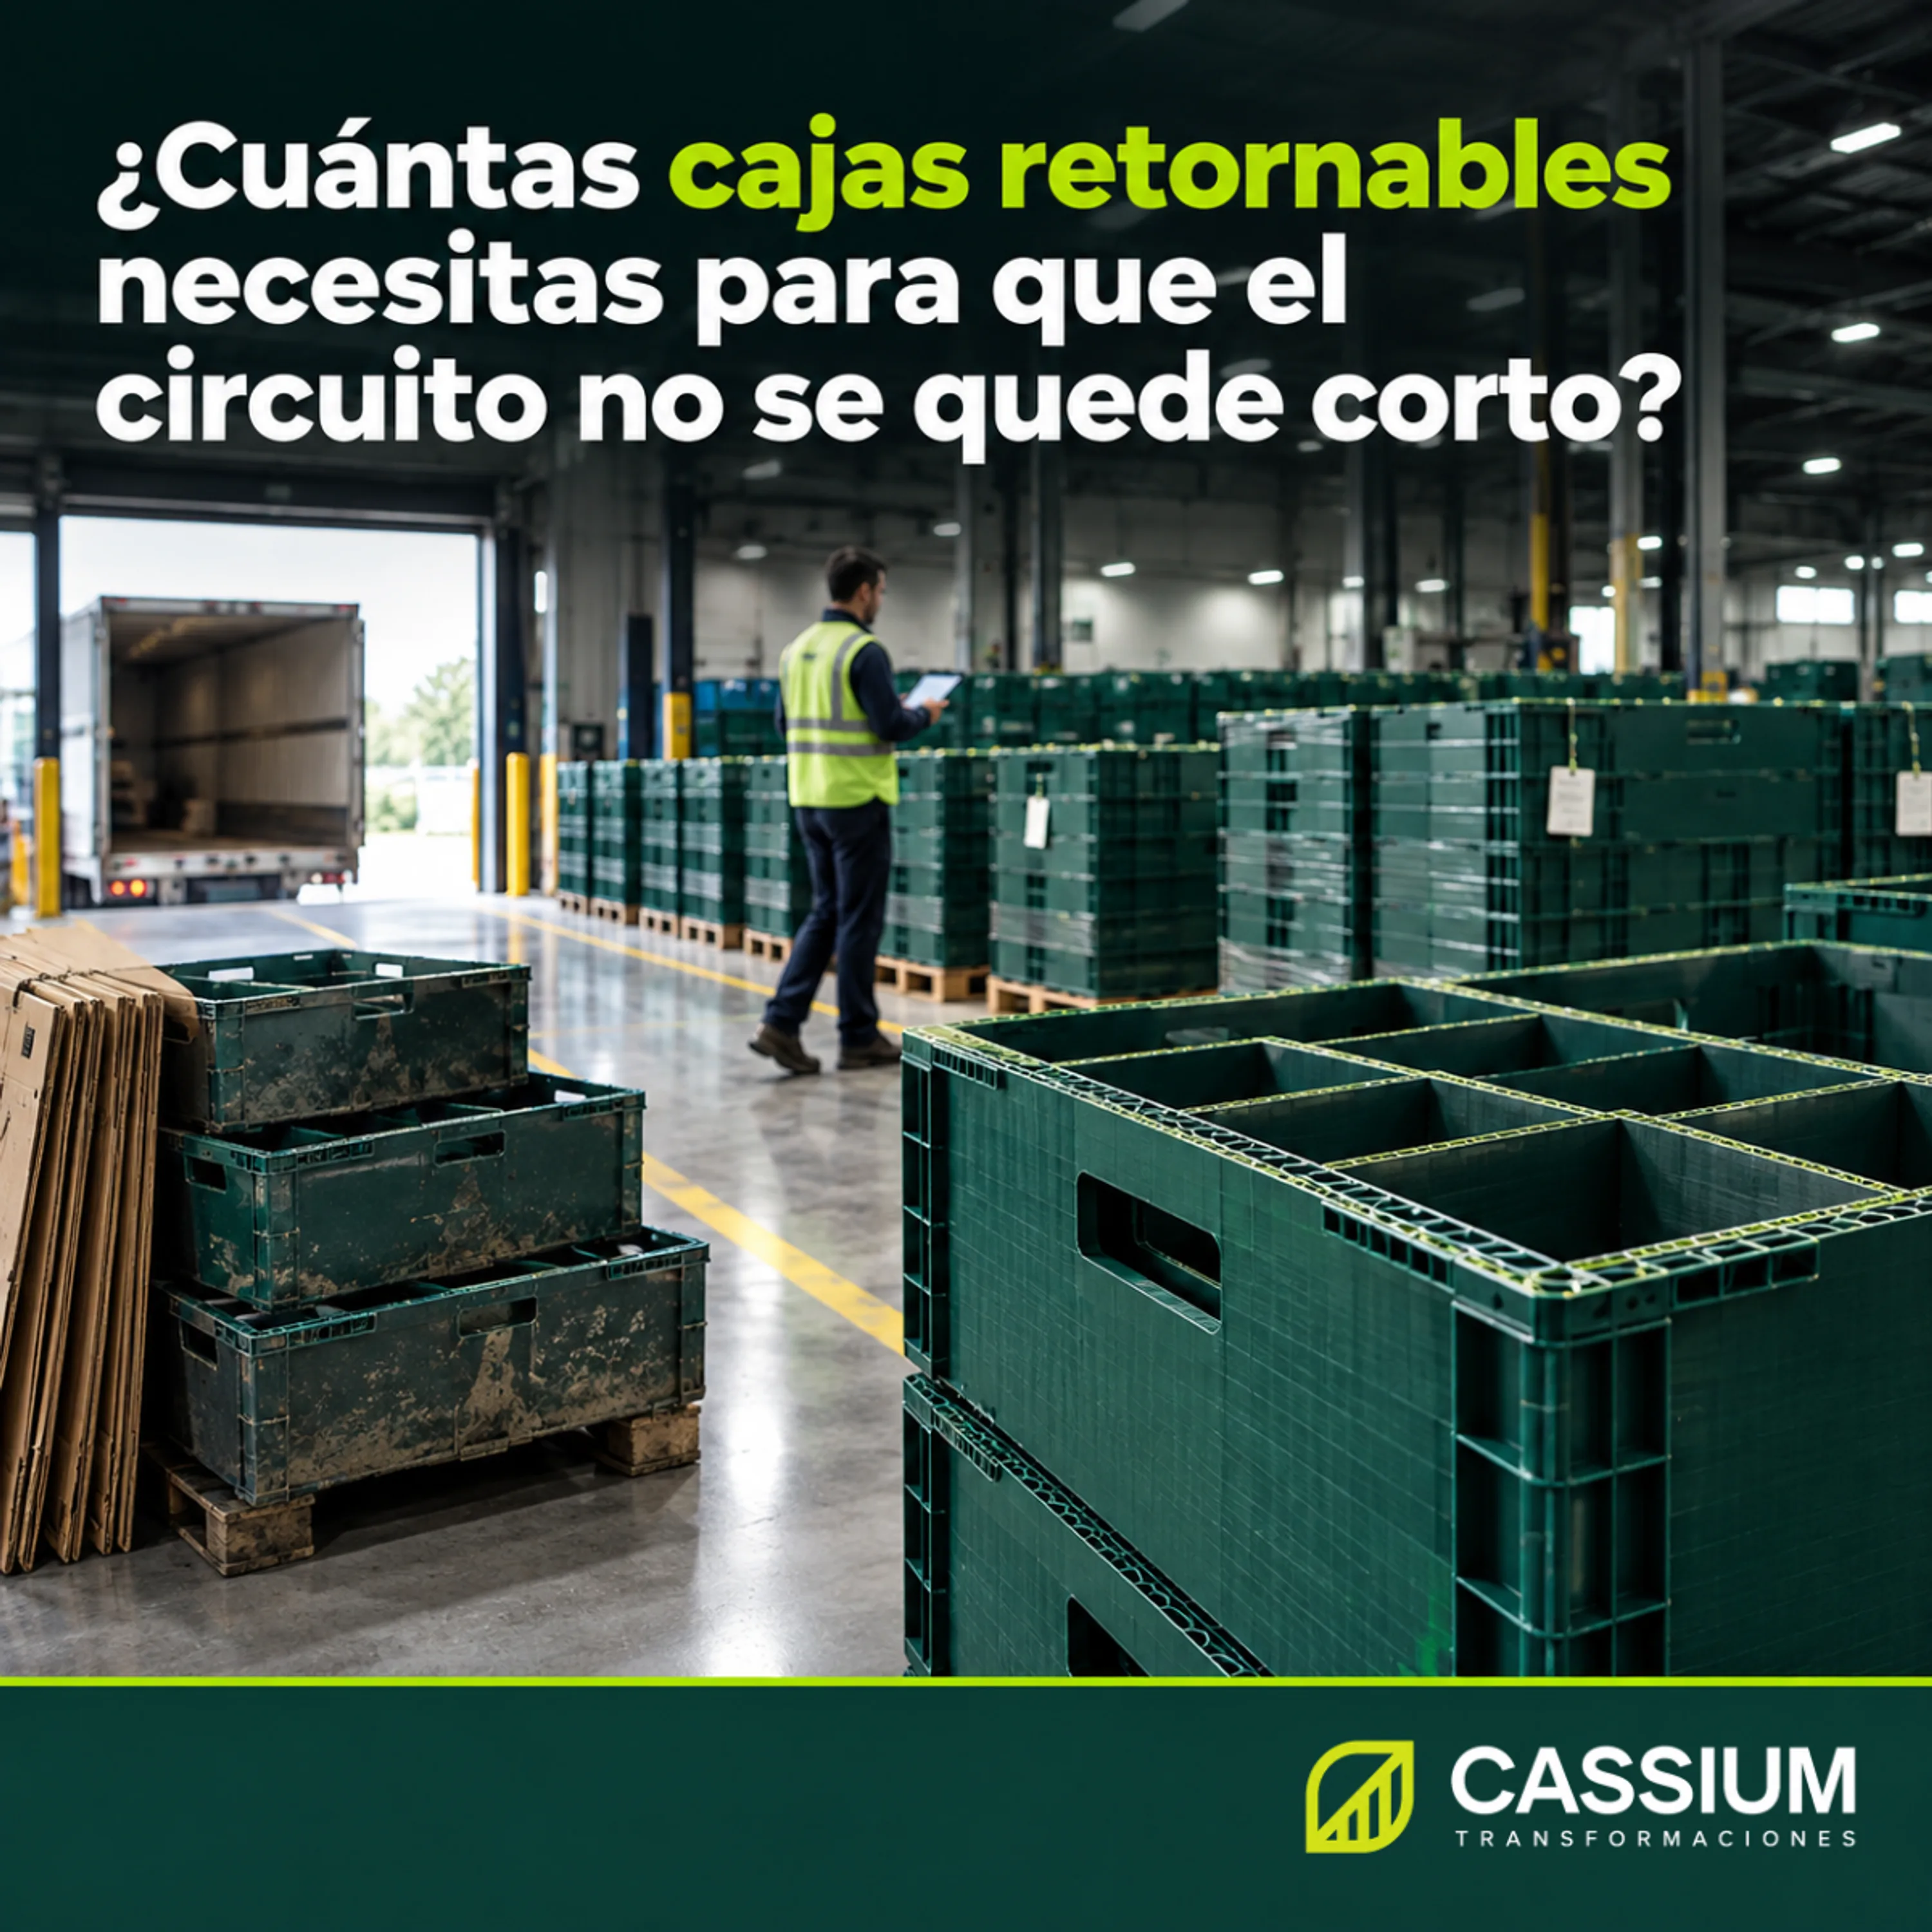
The fleet is calculated as the boxes you fill per day multiplied by the days a box's full cycle lasts, plus a buffer for variation and for replacing shrinkage.
Why daily consumption only gives you half the math
We have already explained in another article how to migrate from cardboard to returnable packaging in stages and why the fleet is sized on the full cycle. Here we work through that calculation step by step, with every figure you need and a numerical example at the end.
Daily consumption tells you the rate at which full boxes leave your plant. Cycle time tells you how many days it takes each box to be available for filling again. The fleet you need is the product of the two: if you fill 40 boxes a day and each one takes ten days to come back ready, you need 400 boxes in circulation so the filling station never has to wait. It is the same logic as Little's law, which industrial engineering uses to calculate a line's work-in-process inventory.
Boxes per day: a figure calculated from the parts
The starting point is the customer's parts demand divided by the number of parts per box, rounded up, because a half-filled box takes up the same place in the cycle as a full one. It is best to use the demand from your highest-volume days and leave the monthly average for the budget. When you fill also matters: if you produce in runs, you may fill a whole week's worth of boxes in a single day, and all of them have to be available that day, even if the customer consumes them gradually.
Full cycle time: the days the truck math leaves out
The math in the opening scenario only considered transportation. A box spends more time sitting still than moving, and every day it sits still is a day it is not available for filling either.
The seven legs of a box's cycle
The full cycle is made up of seven legs: the wait full at your plant until the shipment leaves; outbound transit; the time at the customer with product inside, which includes its safety stock; emptying at its line; the wait empty on its dock until pickup; return transit; and the pass through cleaning and inspection before going back to the filling station. Each leg is measured in calendar days, because a box that reaches a customer on Friday when that customer is closed on weekends stays tied up on Saturday and Sunday.
Inventory at the customer: the coverage its replenishment system requires
The customer almost never empties the box the same day it receives it. Its replenishment system, whether kanban, a delivery schedule or minimum inventory, keeps one or more days of product in its warehouse or next to its line, and each of those days equals full boxes sitting still. If your customer raises its safety stock, as in the opening scenario, your fleet has to grow in the same proportion, even if parts consumption stays the same. It is worth having the agreement with your customer set those days of coverage and the advance notice required to change them.
Pickup frequency: the leg that stretches the cycle the most
Empty boxes wait on the customer's dock until the return truck comes by. With daily pickup, that wait lasts one day; with weekly pickup, a box emptied right after the truck left waits seven days. On average, boxes wait about half the interval between pickups, and for sizing purposes it is best to use the longest case. Increasing pickup frequency usually reduces the fleet more than any other measure, and a collapsible container helps justify it because every trip brings back more empties.
Cleaning and inspection: boxes that are back but cannot be used yet
Returning boxes go through inspection before they are filled again, and in food, beverage or pharmaceutical plants also through washing and drying. If the station works a single shift or gets overloaded on the days the return truck arrives, a queue forms of boxes that are already at your plant and still not usable. That time is also part of the cycle, and measuring it separately tells you whether the bottleneck is on the route or inside your plant.
A step-by-step calculation example
The following numbers are an illustrative example, built only to show how the math comes together. Suppose a part with a demand of 1,200 parts per day and 24 parts per box: consumption is 50 boxes per day. The times for each leg, measured during a pilot, are these:
- Wait full at your plant until shipment: 1 day.
- Outbound transit: 1 day.
- Inventory and consumption at the customer: 3 days.
- Wait empty until pickup, which comes twice a week: up to 4 days.
- Return transit: 1 day.
- Cleaning, inspection and wait to be filled again: 1 day.
The full cycle adds up to 11 days, so the base fleet is 50 boxes times 11 days: 550 boxes. The math in the opening scenario, which only considered the two days of transportation, would have given 100 boxes, less than one fifth of what is needed.
A safety buffer is added to the base fleet. If the longest cycle recorded during the pilot was 13 days, because of a transportation delay or a customer shutdown, the buffer covers those 2 additional days: 100 more boxes. Then the expected shrinkage until the next replenishment is added. If about 10 boxes a month were lost or retired during the pilot and you plan to replenish every quarter, the initial fleet carries 30 more boxes. The total in the example comes to 680 boxes, almost seven times the truck math.
Buffer, shrinkage and replenishment: the fleet that falls short over time
A fleet that was well calculated on day one can fall short six months later. Demand changes, the route changes and every week a few boxes fail to come back. That is why the calculation is reviewed along with the operation, like any other inventory.
The buffer is calculated from cycle variation
A fleet sized to the average cycle runs out of boxes in the week when everything is delayed at once. The most common sources of variation are transportation delays, scheduled customer shutdowns, month-end or seasonal demand peaks and the days when the cleaning station cannot get through everything that arrived. Recording the departure and return date of each box during the pilot gives you the real variation; without that data, the buffer is left to the judgment of whoever signs the purchase.
Shrinkage: the rate that sets how often to replenish
Shrinkage has three causes: boxes that do not come back, damaged boxes that can no longer be repaired and boxes that reach the end of their service life. The first two are measured with the balance of boxes held by each customer and with the inspection records. The third is estimated from the number of cycles each box completes: if the cycle lasts eleven days, each box makes about 33 trips a year, and with the service life confirmed in your operation you know when to schedule the renewal of each batch of the fleet. Our boxes are designed to reach up to 40 uses, and that figure is confirmed by the actual handling in your loop.
When to recalculate the fleet
The calculation is repeated every time a variable changes: a new customer on the same route, a part number added to the same container, a route that gets longer, a change in pickup frequency or an increase in the customer's safety stock. If the same container supplies several customers, it is best to calculate the cycle for each route separately and add up the results, because a long route ties up more boxes for every box you fill per day.
The data worth bringing to the quote for your fleet
With this information, we can size the fleet with you before we manufacture it:
- Daily parts demand on your highest-volume days and parts per box.
- Operating days for your plant and for each customer, including scheduled shutdowns.
- Days of inventory each customer keeps and its replenishment system.
- Route, transit times and frequency of empty pickups.
- Capacity of your cleaning and inspection station.
- Recorded shrinkage, if you already operate with returnable packaging, or the shrinkage measured during the pilot.
At Cassium Transformaciones we extrude our own sheet and make boxes, containers, dunnage separators and trays at the same plant in Monterrey, under an ISO 9001:2015 certified quality management system. That lets us schedule replenishment without import lead times and make every new batch from the same drawing and with the same dimensional control as the original fleet.
If your line has already had to pack in cardboard because no returnable boxes were available, the fleet was calculated with a shorter cycle than the real one. At Cassium Transformaciones we review the route, the time at each point and the shrinkage with you to size the fleet, and we manufacture the replenishment in Monterrey as your operation grows. Tell us about your loop at https://transformaciones.cassium.com.mx/en